In the world of smart homes, few things are as satisfying as watching your electricity bill drop. Recently, I built a custom “single source of truth” for my home’s energy costs, integrating the Octopus Agile tariff with my Sigenergy solar and battery system via Home Assistant.
The Problem: When “Smart” Meters Aren’t Smart Enough
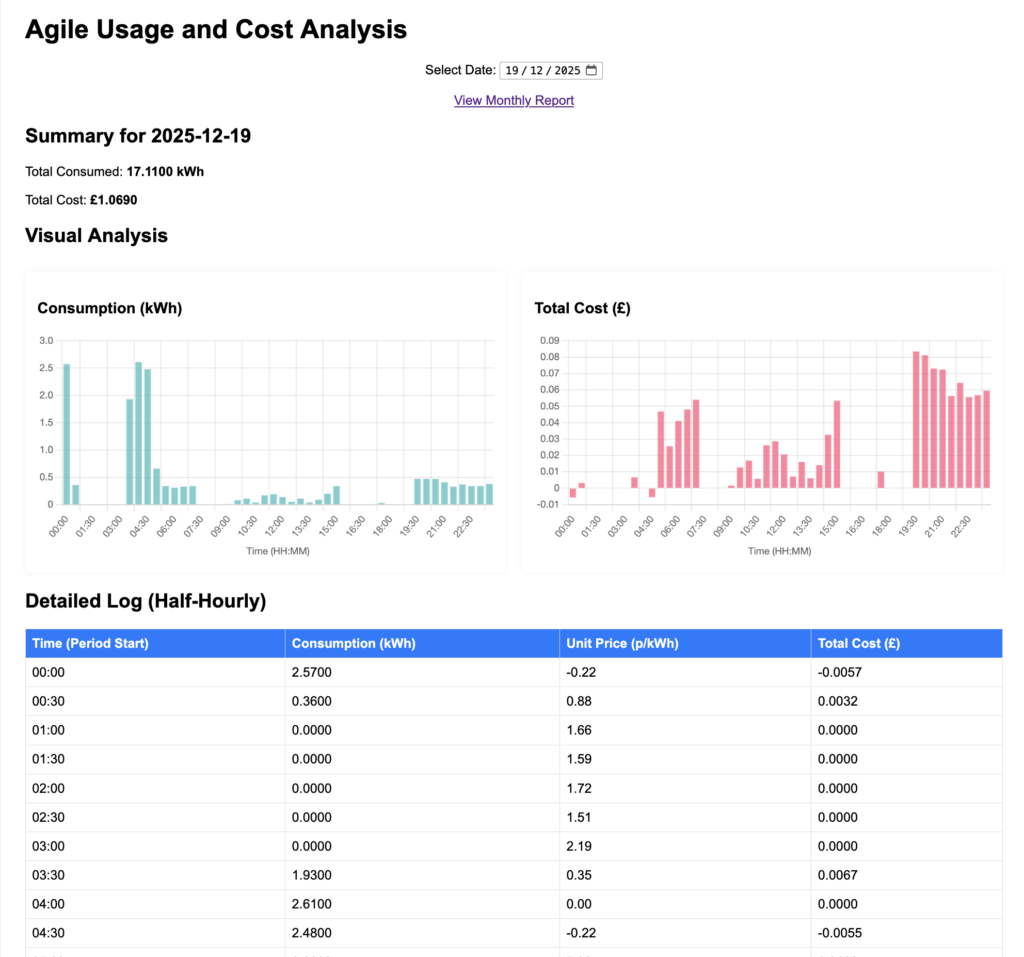
If you are on a dynamic tariff like Octopus Agile, you’ve likely noticed a major flaw with the standard In-Home Display (IHD) provided by energy suppliers. These devices are usually designed for static tariffs. Mine only seems to understand a single, fixed price per hour.
Because Agile prices change every 30 minutes—sometimes dropping into “plunge” pricing where you are paid to use electricity—the standard display was giving me massively over-inflated figures. It could track my usage (kWh) just fine, but the cost data was completely useless. I needed a way to monitor what I was actually spending, not what a basic display guessed I was spending.
The Solution: A Triple-Step Integration
My system relies on three main pillars to bridge the gap between “energy used” and “actual cost”:
- Octopus API: To pull the precise 30-minute unit rates.
- Home Assistant & Sigenergy: To provide real-time data on solar generation, battery status, and grid import/export.
- MySQL & Docker: To store every price point for long-term tracking and historical analysis.
The Technical Setup
To keep the system lightweight and reliable, I built a streamlined Bash and Docker setup:
- Persistence with Docker: I used a
docker-composesetup to run a MySQL instance. By mounting the data folder locally, the data survives even if the container is updated. - Automated Price Polling: A simple Bash script runs every 30 minutes via a cron job. It uses
curlto talk to the Octopus API andjqto parse the JSON response, injecting the true cost into the database.
Summary: Taking Back Control
By bypassing the limited hardware provided by the supplier and going straight to the API, I’ve finally achieved cost transparency. I can now see exactly how my Sigenergy battery is performing—charging when rates are low and discharging when the grid is expensive—with penny-accurate data.
What’s Next?
This database is just the first step. Now that I have a reliable stream of real-time pricing data, my next goal is to build a custom In-Home Display using an ESP32. Instead of a “dumb” display showing static prices, this new device will sit on my desk and show me the true live cost of my energy, pulled directly from my own tracker.