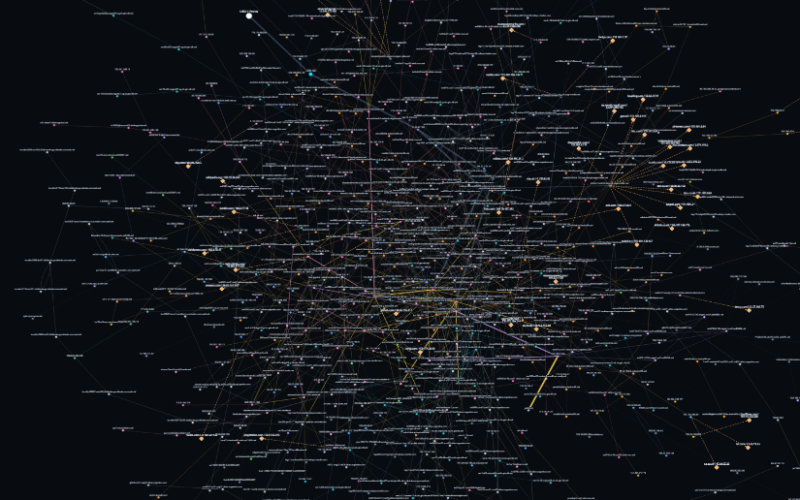
Back in 2013, I built a small project called the UK Internet Report. It started as an excuse to learn RRD graphs and evolved into a site monitoring parts of the UK Internet for latency, packet loss, and outages—including chunks of Virgin Media’s network. You could uncover surprising local network topologies and spot where congestion was biting. Then I got sidetracked.
Recently, I started rebuilding the project with a different goal. Rather than tracking a fixed list of endpoints, I wanted to see how much of the visible Internet routing infrastructure could be discovered automatically and turned into a live map.
The Engine: Random Walks and Smart Skipping
The concept is straightforward. A collector picks a random public IPv4 address and runs a traceroute toward it. The destination itself doesn’t matter and doesn’t even need to respond; the useful data comes from the routers answering along the way. For every responding hop, we log the IP, reverse DNS name, ASN, latency, and discovery timestamps, building a relational graph over time.
Optimization Insight: Every IP address seen in a traceroute is recorded. If a randomly generated target has already appeared as an intermediate hop in a previous trace, we skip it. That single traceroute effectively clears out multiple future targets from our work queue.
With 4.3 billion IPv4 addresses, scanning sequentially would take centuries. But the Internet constantly reuses core routing infrastructure, transit networks, and peering points. We aren’t trying to map billions of end devices; we’re discovering the much smaller graph connecting them.
Deploying Cheap Collectors
Running everything from a single home connection means every route shares the same initial ISP path. To fix that, I built lightweight remote collectors that connect to a central PostgreSQL database via an HTTPS API, grab a target, run a single-threaded traceroute, and push the results back.
The first remote probe went on a Raspberry Pi, followed quickly by a tiny VPS in France (running on 1 vCPU and 1 GB of RAM for under €1.50/month). The difference was instant. The French collector began discovering completely different transit paths and routers, carving out isolated sections of the graph that hadn’t yet overlapped with the UK data.
These disposable collectors use almost no resources—sitting close to idle. Because they are slow, single-threaded, and randomize their targets, they spread traffic safely across the globe without looking like aggressive scanning.
The Picture So Far
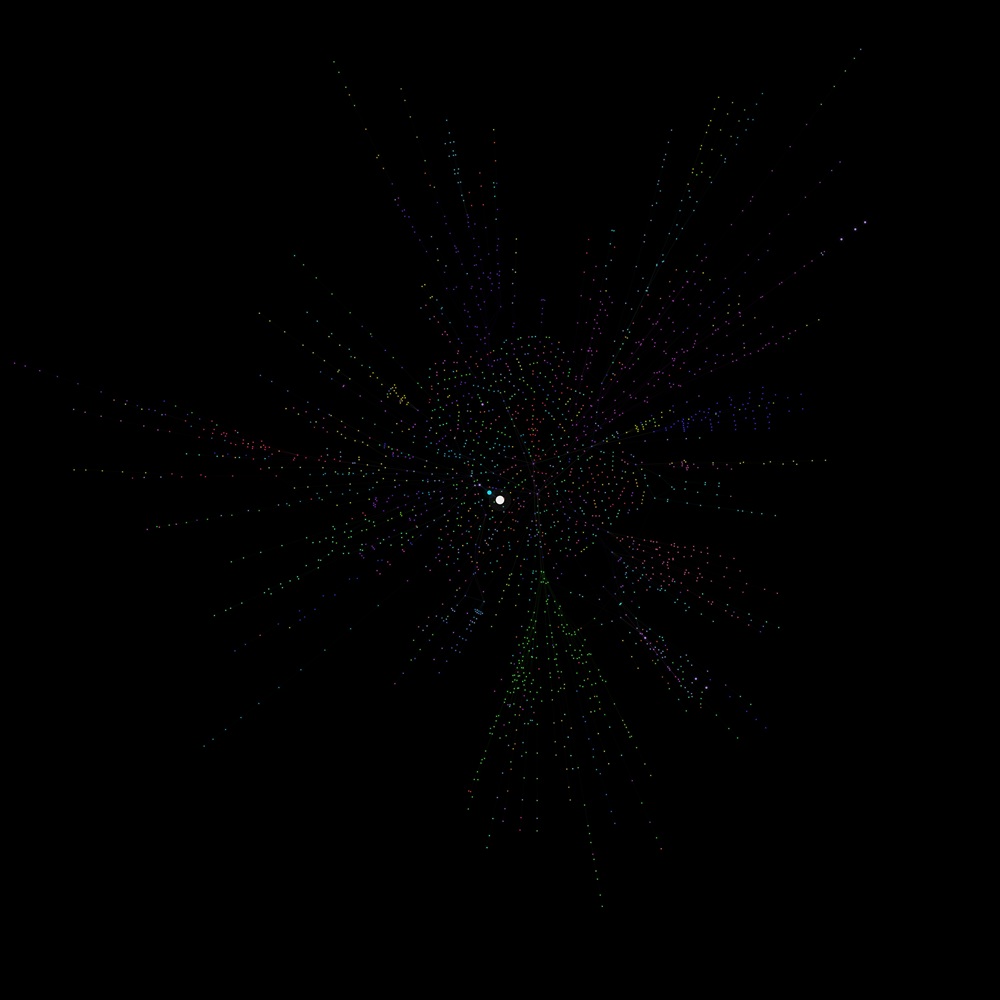
Right now, the data feeds a static renderer capable of spitting out 10,000×10,000 pixel graphs where routers are coloured by ASN. The layout remains stable between runs so you can visually track how the network topology expands day by day.
- Routers: 2,858
- Connections: 2,973
- Traceroutes: 1,411
- AS Networks: 349
I am under no illusion that this will ever become a complete map of the Internet. There are too many filtered routers, hidden links, private interfaces, and unresponsive networks. But with a handful of cheap collectors and a bit of database logic, you can build a surprisingly vast approximation of the visible Internet.
And, if nothing else, it makes for a pretty interesting picture.