
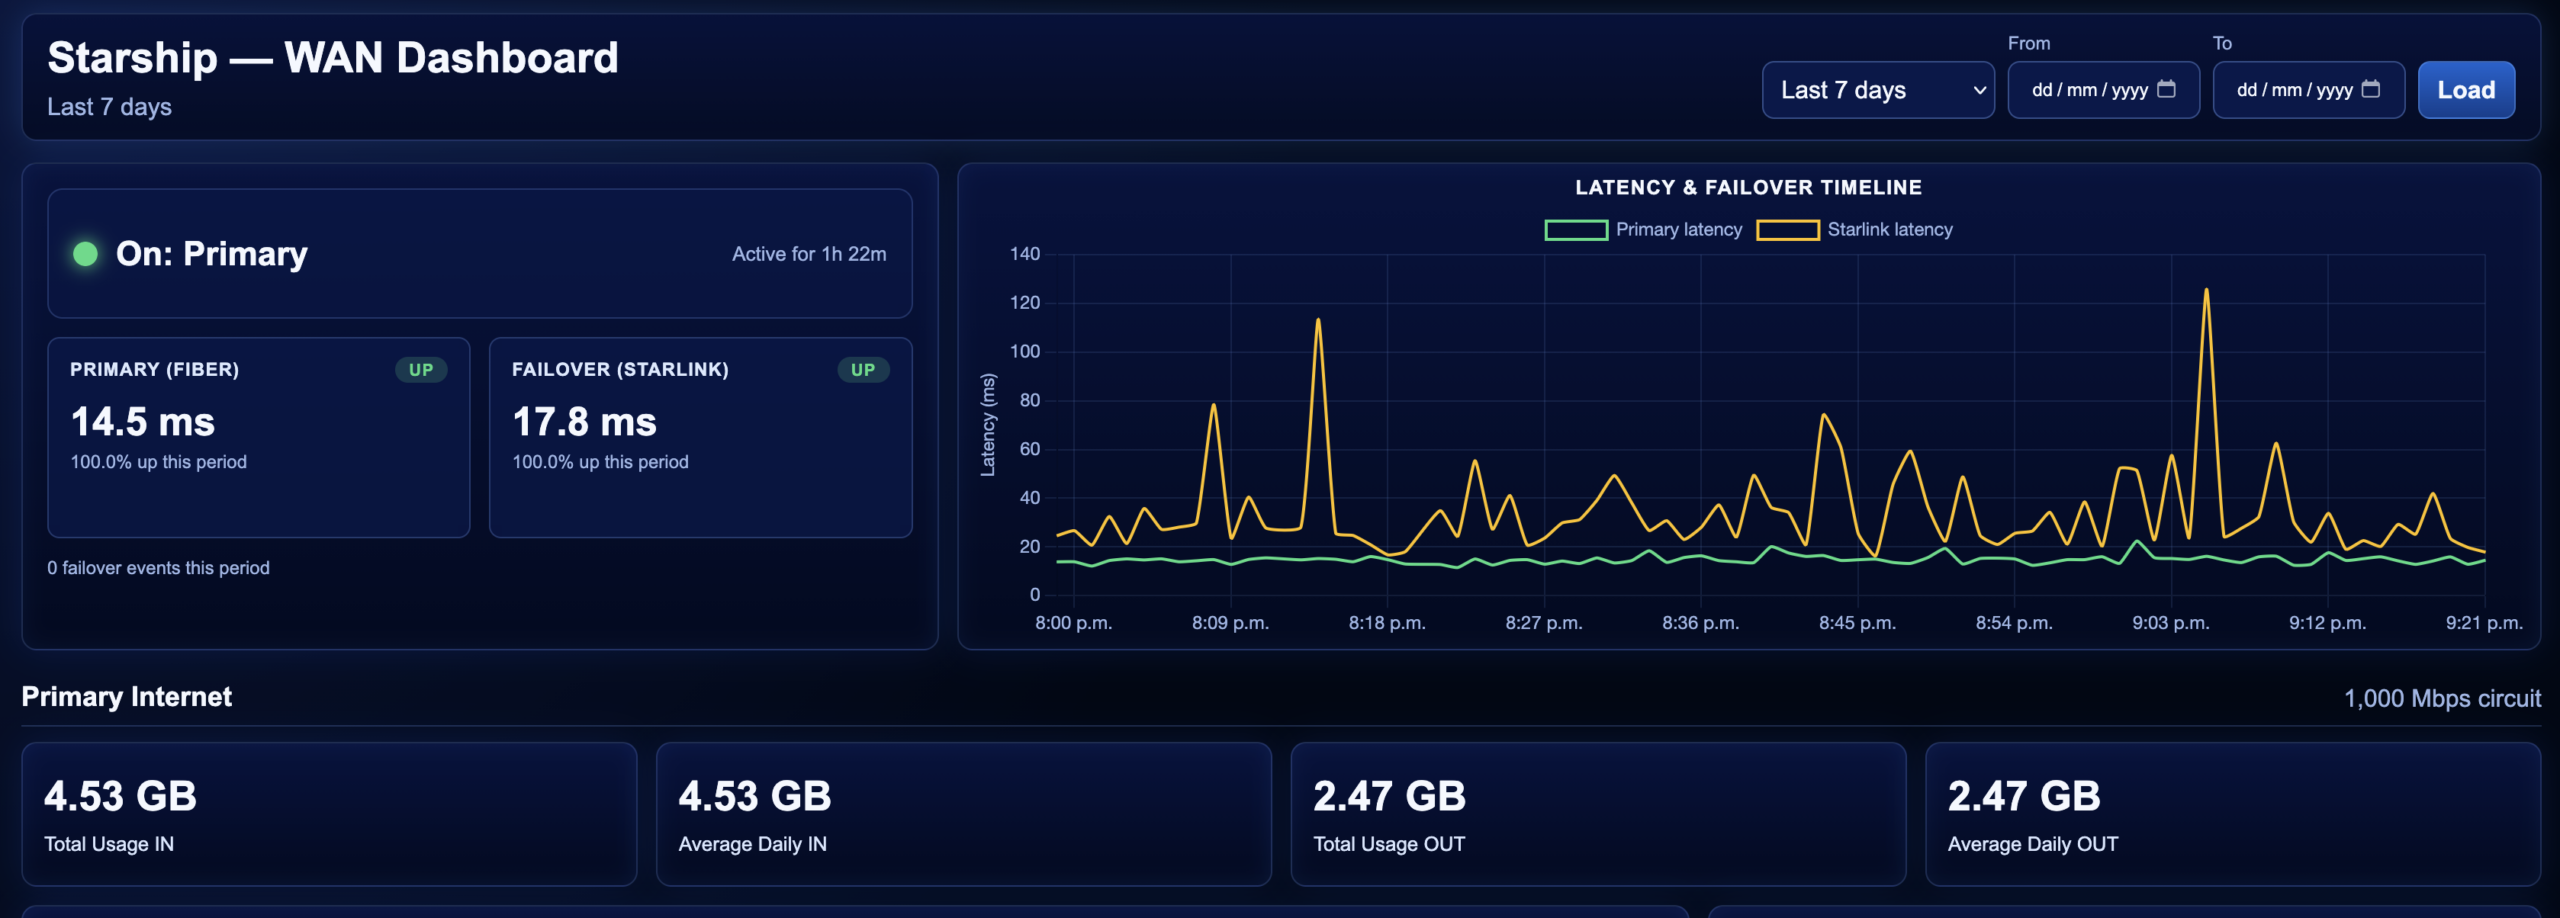
I’ve had Starlink sitting behind my Virgin Media connection as a failover for a while now, quietly doing its job and just as quietly telling me nothing about when it’s doing that job. Failover kicks in, the house stays online, and I have no idea it happened unless I go looking. That’s fine right up until it isn’t — until I’m troubleshooting something else entirely and it turns out I’ve been on Starlink for six hours and didn’t know.
So I built a dashboard. It’s live now at traffic.anthonyparkes.co.uk, and this is the story of how it came together.
The starting point
I didn’t want a general-purpose network monitoring tool with a dozen panels I’d never look at twice. I wanted something built around the one question I actually care about — which line am I on right now, and is it healthy? Everything else got cut before it was ever built.
Getting the data
My UDM-SE — “Cab1”, if you’re wondering — already knows everything I need. It’s just a matter of asking it politely. SNMP against the router’s IF-MIB counters gets me interface octet counts for both WAN interfaces, polled every minute, delta’d against the last reading, and turned into bits-per-second. Nothing exotic, deliberately — no MIB files, no symbolic OID names, just raw numeric OIDs that work identically on any device you point them at, MIBs installed or not.
The failover side needed a different approach, because link-state doesn’t tell you which connection is actually carrying traffic — it just tells you both are technically up. So instead: check the public IP. If it starts with my Virgin Media block, I’m on primary. Anything else, I’ve failed over. Ping two fixed targets alongside that — one routed over each path specifically — and I get independent latency and up-down health for both connections regardless of which one’s active.
The bug that gave my internet a 20,934% utilisation spike
At one point the dashboard cheerfully reported that my 900 Megabit circuit had hit 20,934% utilisation. I wish. That would make for an extremely good broadband deal.
What actually happened: a single bad SNMP read produced a counter delta that, once divided out, turned into a number so far beyond physically possible that it should have been an obvious red flag rather than a data point. The fix was a sanity ceiling — cap any reading against a sane multiple of the interface’s rated speed, and if it blows past that, throw the sample away rather than trust it. I also had to handle the more sensible cousin of that bug: a genuine counter reset — device reboot, SNMP agent restart — shows up as the counter going backwards, which needed its own logic so the collector doesn’t just get stuck comparing against a stale baseline forever.
Fun bug. Not a fun three seconds of graph.
Shipping it
The whole thing runs as one self-contained Docker container — PHP and Apache serving the dashboard, cron inside the same container polling both collectors every minute. Code and config are bind-mounted rather than baked into the image, so I can tweak thresholds or fix a label without a rebuild. Data lives in its own mounted volume too, so a container rebuild doesn’t wipe out weeks of history.
What it actually shows
Two panels, one glance:
Which connection is active right now, and how long it’s been on that path. Latency and uptime for both, independently, regardless of which one’s carrying traffic. Capacity and utilisation for each circuit — daily traffic, peak usage, how much time is spent near the warning and critical thresholds.
That’s it. No fluff, no charts I’d never look at twice. Just the two questions I actually wanted answered when I started this: what’s my connection doing, and can I trust it.
It’s public if you want to poke at it — traffic.anthonyparkes.co.uk. I’m not putting the code up for now, but happy to talk through any of it if you’re building something similar.